INTRODUCTION
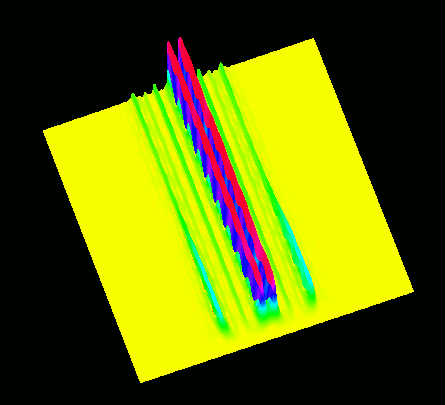
Timbre is the temporal development of harmonics within a musical sound. A time-frequency representation is needed to show this temporal development. Timbre morphing is the process of combining two or more sounds to create a new sound with intermediate timbre and duration. Two sounds are sampled from two chosen instruments, a clarinet (clarinet sound) and a violin, (violin sound)over their ranges, i.e. from a low register to a high register. One sound (pitch or note of specified duration, e.g. the note A=440Hz for four beats at M.M. =100) from each instrument gives the two original sounds to be morphed. These two sounds are then processed using the Wigner Distribution producing a frequency-temporal distribution of each sound. The Wigner Distribution is implemented in the Khoros image processing system, giving a frequency-time surface representing the spectra of each sound. These spectra indicate the development of the individual partials of each sound over time with a complete surface representing an entire sound. Each topological surface is then examined for the occruuence of characteristic points including unique features, e.g. start of attack, peak of attack etc., and repeatable features, e.g. vibrato cycles.
The two surfaces representing the two completed sounds are morphed together by interpolating between the features in each sound. Interpolation may implement a simple mean of each surface. We develop the mathematical theory underlying more sophisticated non-linear morphing. The result of interpolation is a new intermediate surface representing the morphed sound's features. This surface is compared visually and mathematically with the surfaces of the two original sounds.
Students from the Department of Music at National University of Ireland, Maynooth were involved in the recording of the two original sounds.
Conference Papers presented at the Mind II Conference
Timbre Morphing Using the Wigner Time-Frequency Distribution.
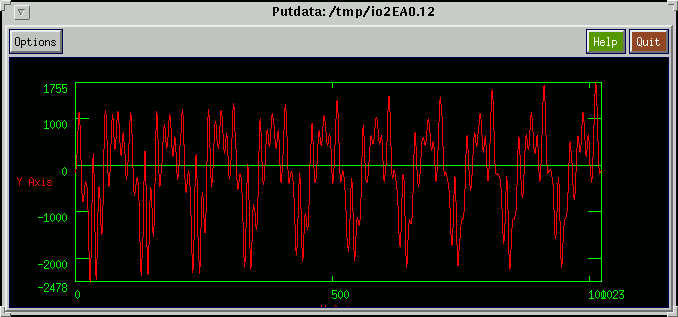
Violin signal (1024 points) of the note A4=440Hz.
Wigner Distribution (SPWD) of violin sound.